In the previous post, we explored my custom ClickHouse backup agent, built upon the clickhouse-backup tool, logrotate, Cron and Bash scripts. I have also shared all the necessary resources for testing the agent on your local machine using Docker as well as Docker Compose or deploying it in a production environment. Let’s update the agent’s repo with some Python code.
You may be familiar with a main GitOps principle: use Git as the single source of truth; store your applications and infrastructure configurations in a Git repository along with application code. Kubernetes (yaml), Terraform (tf), Docker, Compose files, Jenkinsfile and even diagrams can be good examples of files kept in such repositories. But how to represent diagrams? As png, vsd or jpeg? Let’s pretend we’re developers and can draw diagrams using code.
The diagrams project brings this approach to life. I opted for Diagrams (mingrammer) because it’s free and built on Python and Graphviz, widely used language and tool that enable you to create various diagrams, whether it’s a flowchart or a cloud architecture. Another advantage is that the project is actively maintained and continuously developed. You can also check out other tools such as pyflowchart, mermaid, plantuml or terrastruct.
Let’s get started and draw a flowchart for the clickhouse backup agent using Diagrams (mingrammer). First, install Python (>3.7; mine is 3.11) and Graphviz (9.0.0, Windows in my env), then install diagrams module (0.23.4).
Diagrams include the following objects: node (=shapes; programming, azure, custom and others), edge (=connection lines; linkage between nodes), cluster (=group of isolated nodes) and diagram (represents your entire chart). Each object has it’s own attributes. Description of all attributes can be found at Graphviz docs. Also, check out basic examples to understand what we gonna “build”. I won’t describe every attribute. DYOR.
I use general Node class with custom images which were taken from programming nodes and then optimized to my flowchart (I’ve deleted canvas and resized images). You could safely use diagrams.programming.flowchart node class instead, but be ready to play with height/width node’s attributes. Another way to add your own images as nodes is Custom node class.
We have described icons and shared nodes. Now we need to add the first group of nodes to represent the main process of the agent and flowchart (creating and uploading FULL backups):
As a result, I’ve updated the repo with diagram as code; slightly modified GitHub actions by adding a new step to “draw” diagram and check python code. When I push new commits to the repo, the diagram is created and published as an artifact with nodes (start, end, condition, action, catch, input/output), four clusters (main, diff, log, upload log) and edges between nodes.
In today’s data-driven world, managing and protecting your data is paramount. We have already learned how to backup PostgreSQL here. And now it’s our turn to discuss ClickHouse, an open-source columnar database management system, that is renowned for it’s high performance and scalability.
I will explain a Dockerized cron job designed to facilitate the backup of ClickHouse databases, whether they are located on a single host or within a clustered environment with shards and replicas.
The agent is based on the Alpine Docker image and uses the clickhouse-backup tool, which has the ability to work as a REST API service. Logrotate has been added to manage the log files produced by the backup agent.
The agent does the following:
creates scheduled FULL or DIFF backups (POST to /backup/create)
checks “create backup” action status before every upload (GET to /backup/status)
uploads each backup to a remote storage (POST to /backup/upload/)
checks and waits until upload operation finishes (GET to /backup/actions)
manages log file with API responses and errors
generates customized output to standard container logs
if a backup is not uploaded to remote storage, it’s marked as failed and will not be used as the last backup for subsequent DIFF backups
Important: according to the clickhouse-backup official FAQ, “incremental backups calculate increment only during executing upload or create_remote command or similar REST API request”. In other words, DIFF and FULL local backups are actually the same (clickhouse-backup list local). Clickhouse-backup creates local backups first before uploading them to remote storage.
If you list remote backups using the command (clickhouse-backup list remote), you will notice the distinction between these two backup types. This is why the agent only issues a warning when you attempt to create a DIFF backup for the first time without having any prior FULL backups
Default settings:
DIFF backups: every hour from Monday through Friday and Sunday, plus every hour from 0 through 20 on Saturday
FULL backups: every Saturday at 8.30 PM
Rotate and compess logs weekly, rotated 14 times before being removed
Clickhouse-backup API basic authentication is enabled (rlAPIuser)
Clickhouse server authentication is enabled (rlbackup)
./agent/clickhouse-backup.sh – script to define backup and upload steps
./agent/cronfile – cron job backup and logrotate tasks
./github/workflows/docker-image.yml – simple GitHub action to build agent’s docker image on every Dockerfile change
Possible use cases
As a resource for learning Docker, Docker Compose, Bash, cron, and logrotate.
As a source of scripts, cron job tasks, or Docker files. Just grab them and you are all set.
As a sample of pairing ClickHouse-Backup and ClickHouse Server.
How to use
check out logrotate and cron settings in the agent folder
verify the Dockerfile in the agent folder (if docker is being used)
adjust clickhouse backup settings if necessary (./clickhouse/clickhouse-backup-config.yml) Change credentials, clickhouse host and remote storage at least
clickhouse-backup API container or standalone service shoud have access to /var/clickhouse/ folders to create backup successfully. In case of a container, see docker-compose.yml. If your clickhouse-backup API is a Linux service, run the service on the first replica for each shard, and then update cronfile accordingly.
copy cron and script files to a remote host, and then make a test run
in the case of using Docker, please check the docker-compose.yml file and remove any unnecessary services (such as clickhouse and ftp). Afterward, run docker-compose up -d –build to get containers started
use docker logs or docker compose logs to check service logs. Log files are also located under the /var/log/clickhouse-backup/ folder
Since the ch-backup-agent image already comes with the clickhouse-backup application pre-installed, you have the option to run both the API and scripts within the agent’s container. To achieve this, you should create a volume mapping for the ./clickhouse/clickhouse-backup-config.yml file and then start the clickhouse-backup API server as a service.
function check_upload_status {

        # Catch In Progress status
        while [ "$(check_upload_req | jq -r .status )" == "in progress" ]; do
            echo -e "\n${GREEN}[INFO]${OFF} ${BOLD} Upload of the ${BACKUP_NAME} is still in progress...${OFF}"
            sleep 1m
        done

        # Catch Error status
        if [ "$(check_upload_req | jq -r .status )" == "error" ]; then
            echo -e "${RED}::::[ERROR]${OFF} ${BOLD} Couldn't upload the backup ${BACKUP_NAME}:${OFF}"
            {
            printf '\n%s\n' "UPLOAD ERROR:"
            check_upload_req | jq -r .error
            printf '%s\n' "-------------"
            } | tee -a "$BACKUP_LOG"
            return 1

        # Catch Success status
        elif [ "$(check_upload_req | jq -r .status)" == "success" ]; then
            echo -e "\n${GREEN}[INFO]${OFF} ${BOLD} The ${BACKUP_NAME} is now the last since it's just been uploaded successfully${OFF}"
            touch "${LAST_BACKUP_NAME}"
            echo -n "${BACKUP_NAME}" > "${LAST_BACKUP_NAME}"
        fi
}
Useful commands
While I have tested every command below, I strongly encourage you to learn about clickhouse-backup and its FAQ before proceeding with any restore operations. Your setup may have unique configurations and requirements!
If you’re getting “warn <table name> skipped cause system.replicas entry already exists and replication in progress from another replica logger=clickhouse”, try to run the previous command with CLICKHOUSE_CHECK_REPLICAS_BEFORE_ATTACH=0
If you need to restore schema, use –schema parameter and –rm to drop existing schema objects: clickhouse-backup restore –rm<backup name> –schema or delete replica metadata in Zookeeper beforehand.
Result
Noticed the warning? It’s not critical. Just FYIA sample output with error, warning and info messagesThis is how the log file appears. All you need – errors and requests’ outputDIFF backup created successfully, therefore the last backup name had been updated as well
Have you ever faced any issues with git clone? Personally, I can’t recall any significant or memorable problems I’ve encountered while cloning remote repositories. Typically, the issues were related to authentication or network connectivity. Therefore, there was nothing particularly special to write about. However, as you work with different environments, the chances of coming across something interesting enough to share increase, even though it might be obvious to some.
Let’s take a simple example: you’re trying to clone an existing repository, which was created by someone else. The repository had already been filled out with files you need. Assuming you have credentials in place, you run git clone <repo’s url> on your Windows machine and get the following:
I hid the error message. I’ll reveal it later
What could go wrong? The cloning process succeeded, indicating that the issue is not related to Git credentials or network connectivity. However, the checkout process failed. What does this mean? It means that if you navigate to the folder of the cloned repository in the explorer, you won’t find any files written to the disk. Now, let me reveal the full error message, which is straightforward:
error: invalid path 'config/app1/application-staging.yml '
fatal: unable to checkout working tree
Found a “root cause”? There is the whitespace at the end of the filename.
However, you may wonder, since the repository was pre-created and used by other people, how did this happen? You’re correct to question that.
The reason is that Windows doesn’t support trailing space characters and automatically removes them when saving a file (you can read more about it here). On the other hand, Linux does support both leading and trailing whitespaces in filenames.
“file1.txt” and “file1.txt ” are two different files actually
Git knows about these limitations and has a special config setting to control it:
core.protectNTFS
If set to true, do not allow checkout of paths that would cause problems with the NTFS filesystem, e.g. conflict with 8.3 “short” names. Defaults to true on Windows, and false elsewhere.
The reason why other people can clone the repo without issues is that core.protectNTFS is set to false (manually or because of underlying OS)
So, to clone the repo on Windows you can use the following command:
get clone -c core.protectNTFS=false <repo url>
and now you can fix the wrong filename and sync with remote repo
As a summary, I would advise all developers and DevOps engineers to strictly avoid using trailing or leading spaces in filenames altogether. By doing so, we can eliminate the potential conflicts and issues that may arise from incompatible behaviors between different operating systems.
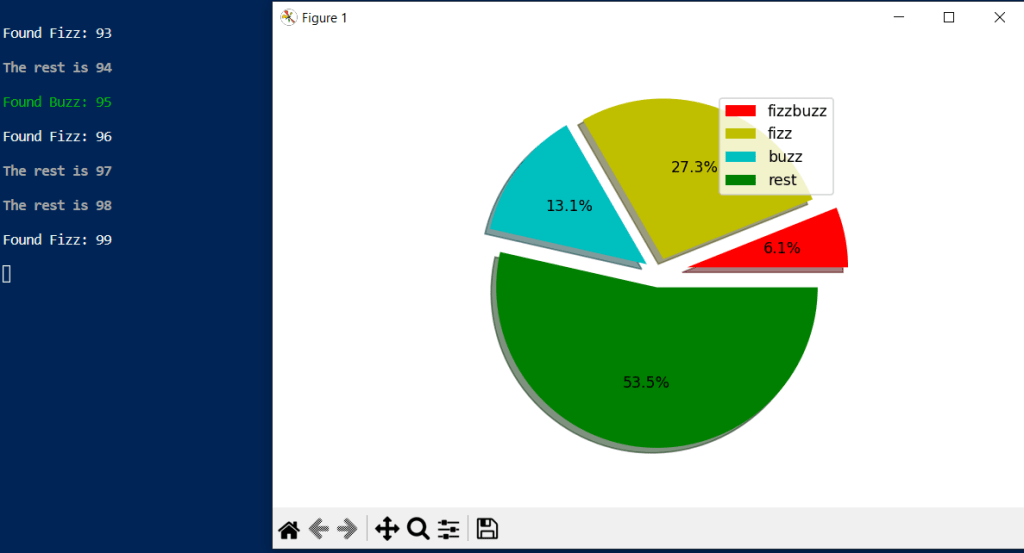
FizzBuzz is a very common task, asked in Dev/DevOps interviews. You are given a range of numbers and need to write algorithm using the following rules: if the number is divisible by 3, print “Fizz”; if the number is divisible by 5, output “Buzz”; if the number is divisible by both 3 and 5, the result should be “FizzBuzz”.
The main goal of the task is to check how you understand loops, conditionals and simple math using one of programming or scripting languages. I solved the task using PowerShell years ago: check this gist.
I used matplotlib and colorama to make a pie chart and add color text output respectively. Defined a function fizz_buzz with 2 arguments, and then used try/catch/finally statements to catch exceptions errors. Inside of the try, the for loop and if conditionals are described to meet all task’s rules. As a result, the function outputs numbers and categories based on rules, and makes a pie chart to show how many fizz, buzz, fizzbuzz found in percentage.
import matplotlib.pyplot as plt
import colorama
from colorama import Fore, Back, Style
colorama.init()

def fizz_buzz(x,y):
    """Python version of popular Fizz Buzz task"""
    fb = 0 ; b = 0; f = 0; rest = 0 # start values
    fb_type = ['fizzbuzz','fizz','buzz','rest'] # plot labels
    fb_colors = ['r','y','c','g'] # plot colors
    fb_explode = [0.2, 0.1, 0.1, 0.1] # plot fraction of the radius
    try:
        for n in range(x,y):
            if ((n % 3 == 0) and (n % 5 == 0)):
                fb += 1
                print(Fore.RED + f"Found FizzBuzz: {n}")
            elif n % 3 ==0:
                f += 1
                print(Fore.WHITE + f"Found Fizz: {n}")
            elif n % 5 ==0:
                b += 1
                print(Fore.GREEN + f"Found Buzz: {n}")
            else:
                rest += 1
                print(Style.BRIGHT + f"The rest is {n}")
            print(Style.RESET_ALL)
        fb_array = [fb, f, b, rest]
        plt.pie(fb_array, colors = fb_colors, explode = fb_explode, shadow = True, radius = 1.1, autopct = '%1.1f%%') # form a pie
        plt.legend(fb_type,loc='upper right') # show legend
        plt.show() # show a pie
    except:
        print(Style.BRIGHT + Fore.RED + "You provided wrong x and y")
        print(Style.RESET_ALL)
    finally:
        print(Style.BRIGHT + Fore.GREEN + "Author: github.com/rlevchenko")
        print(Style.RESET_ALL)
Dockerized cron job to backup PostgreSQL database or multiple databases on different hosts. It’s based on Alpine docker image, so the image size is less than 11 Mb. The script can be also used without docker and docker compose or as a base for your own dockerized cron jobs. My general recommendation is to run docker container on your backup host to provide a kind of isolation from the management partition.
The script or “agent” does the following:
Reads content of /config/passfile to get pg_dump connection parameters
Verifies if the backup can be done by executing a dry run for each db
If the dry run is completed and plain format set, produces plain-text sql script and compresses it with gzip
If the dry run succeeds and custom format set, outputs a custom backup archive (more flexible and by default)
Cleans up the storage folder. Files older than 30 days are deleted
Redirects all cron job statuses to stdout
Keeps backup files under ./psql/backups/{hostname}/{dbname}/ on your host
Default settings: twice a day at 8:30 and 20:30 UTC; custom format; clean backups older than 30 days
Current limitations:
no encryption for specific databases (in to-do list)
no handling of wildcars in passfile (in to-do list)
Content
Dockerfile – describes docker image
docker-compose.yml – docker compose file to build and run agent service
/config/cronfile – cron job schedule settings
/config/passfile – PostgreSQL .pgpass actually
/config/psql_backup.sh – the script itself
Usage guide
check out the passfile and provide your own connection parameters
verify the cron job settings in the /config/cronfile
change make_backup function argument to set format output (plain/custom)
update cleaner function argument at the bottom of the script if necessary
edit dockerfile/docker-compose.yml or script itself if necessary
run docker compose build
run docker compose up -d
check out the stoud of the container to get the job’s status
TO RESTORE: use psql (if plain set) or pg_restore command (if custom format set)
# Clean old backup files
function cleaner()
{
set -o pipefail -e
	if [[ -n $(find $BACKUP_DIR \( -name "*.sql.gz" -o -name "*.custom" \) -type f -mtime +"$1") ]];
	then
		echo -e "\n${GREEN}[INFO]${OFF} ${BOLD}There are backup files older than $1 days. Cleaning up the following files:${OFF}"
		find $BACKUP_DIR \(-name "*.sql.gz" -o -name "*.custom" \) -print -type f -mtime +"$1" -exec rm {} \;
	else
		echo -e "\n${GREEN}[INFO]${OFF} ${BOLD}There are no backup files older than $1 days. \nHave a nice day!${OFF}"
	fi
set +o pipefail +e
}
If you’re reading this post, you’re trying to find a way to edit an existing service connection with a new service principal secret/key.
It’s a weird that UI and devops cli don’t allow us to quickly change service connection details if it was created automatically by Azure DevOps (“creationMode”: “Automatic”; will talk about it a bit later).
So, how to change a secret? Answer: Azure DevOps REST API. Note: if you have correct permissions, try out the steps at the bottom of the post. The steps below are for those who don’t have Owner permissions.
Go to Project Settings – Service Connections, choose your connection and click on Manage Service Principal. Add a new secret and note it’s value.
Choose a tool to work with REST API. It could be either PowerShell or Postman, for instance. I will show both.
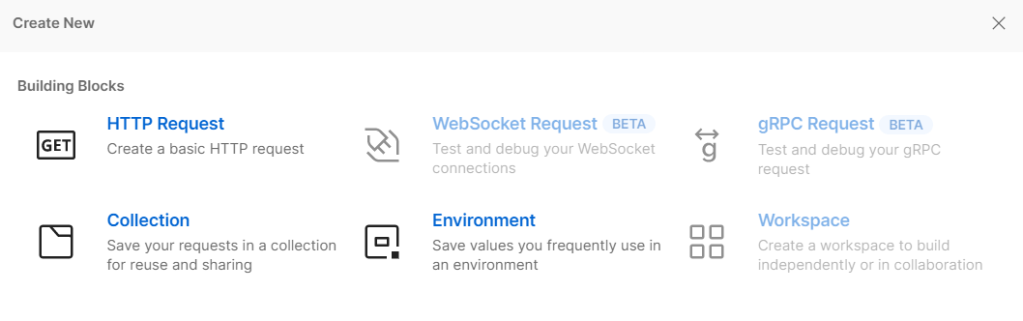
[Postman] Install Postman and create a new HTTP Request
Postman – File – New – HTTP Request
[Postman] Go to Authorization and paste PAT token to the password field
PAT token should be used as password for any REST API requests
[Postman] Using the following GET request, get a service endpoint details in JSON format. Organization Name, Project Name and Endpoint Name are parts of the URI (can be taken from service connections list in the azure devops ui) :
[Postman] Using a PUT request update the service connection. Make sure you set Body – Raw to JSON , and then Paste JSON copied in the previous step to the Body
Body – RAW should be set to JSON
Here is a tricky part. Prior to sending PUT request, change creationMode from “Automatic” to “Manual”. Also, in my case, I had to delete the following parameters spnObjectId and appObjectId (data section). Plus, I added serviceprincipalkey with a value set to a new secret (authorization section) A short excerpt is provided below:
That’s it. Now you know how to change a service connection with a new secret without removing a connection and customizing all pipelines in a project.
P.S. If you have Owners permissions on the app registration/service principal used by the connection, try to edit the connection by adding a description, and then click on Save. Azure DevOps should create a new secret and update the connection automatically.
January, 2024: added examples of for_each/count blocks
Terraform-based deployment of almost all Azure Data Services (default deployment settings are in the parenthesis):
Azure Service Bus (Standard, namespace,topic,subscription, auth. rules)
Azure Data Lake Storage (ZRS, Hot, Secured, StandardV2)
Azure Data Factory (w/Git or without)
Azure Data Factory linked with Data Lake Storage
Azure Data Factory Pipeline
Azure DataBricks WorkSpace (Standard)
Azure EventHub (Standard, namespace)
Azure Functions (Dynamic, LRS storage, Python, w/App.Insights or without)
Azure Data Explorer (Kusto, Standard_D11_v2, 2 nodes)
Azure Analysis Server (backup-enabled, S0, LRS, Standard)
Azure Event Grid (domain, EventGridSchema)
Azure SQL Server (version 12.0)
Azure SQL Database (ElasticPool SKU name, 5 GB max data size)
Azure SQL Elastic Pool (StandardPool, LicenseIncluded, 50 eDTU/50GB)
Properties and content
Over 1k strings and 26 terraform resources in total
Almost every string is commented out, multiple conditions in each resource, variable conditions to check it’s value before the deployment and etc. So, it’s flexible, not hardcoded and allows you to create infrastructure with your own set of resources.
Written a few years ago, updated once since then to fix deprecated features
June, 2021 Update: SQL Server, Database and Elastic Pool , added variable conditions (for example, sql password must be longer than 8 symbols and have upper-case, digits and special characters), added a sensitive variable (just for sample), new Terraform 0.15.5 syntax/features were added, multiple minor changes
January, 2024 Update: examples of count and for_each blocks are shown here
Tested with the latest Terraform 0.15.5 and Azure provider 2.62.0 (the first version of the script worked fine with >=0.12 and AzureRM >=1.35, just check the syntax and try out)
auth.tf – provider authentication and version settings
main.tf – a desired Azure infrastructure
terraform.tfvars – controls deployment settings
variables.tf – variables list
outputs.tf – outputs useful information
Deployment settings (excerpt)
#--------------------------------------------------------------
# What should be deployed?
#--------------------------------------------------------------
servicebus       = true  # Azure Service Bus
datafactory      = true  # Azure Data Factory
datafactory_git  = false # Enable GIT for Data Factory? (don't forget to set Git settings in the Data Factory section)
databricks       = true  # Azure DataBricks
eventhub         = true  # Azure EventHub
functions        = true  # Azure Functions
functions_appins = true  # Integrate App.Insights with Azure Functions?
eventgrid        = true  # Azure EventGrid
kusto            = true  # Azure Data Explorer (kusto)
analysis         = true  # Azure Analysis Server
sqlserver        = true  # Azure SQL Server
sqlep            = true  # Azure SQL Elastic Pool
sqldb            = true  # Azure SQL Database
variable "az_sqlserver_password" {
  type        = string
  description = "Azure SQL Server Admin's Password"
  validation {
    condition     = length(var.az_sqlserver_password) > 8 && can(regex("(^.*[A-Z0-9].*[[:punct:]].*$)", var.az_sqlserver_password)) # meets Azure SQL password's policy
    error_message = "SQL Server Admin's password must contain more than 6 symbols (lowercase + upper-case and special/punctuation characters!)."
  }
}
Usage guide
Open the terraform.tfvars file
Indicate the “What Should Be Deployed?” section
Use true/false to set your desired configuration
Check or change Azure services settings in the appropriate sections (naming convention (prefix/suffix), location, SKUs and etc.)
Run terraform init to get required Terraform providers
Run terraform plan to initiate pre-deployment check
Run terraform apply to start a deployment
(optional) terraform destroy to delete Azure resources
Requirements
The script uses Service Principal authentication, so define the subscription ID, client ID, tenand ID and principal secret in the auth.tf (or use another authentication type – Managed Identity, if your CI is running on Azure VMs, for instance)
If you are going to deploy Analysis Server (enabled, by default), provide valid Azure AD user(s) UPN(s) to set them as administrators of Analysis Server (az_ansrv_users variable, file – terraform.tfvars)
Result
P.S. feel free to share/commit/fork/slam/sell/copy and do anything that your conscience allows you 🙂
Heptio (it’s founders co-created Kubernetes) polled about 400 IT decision makers from different sectors and company sizes to find out whether they use Kubernetes or not, understand obstacles and overall experience. About 60% of respondents are using Kubernetes today, and 65% expect to be using the technology in the next year. More surprisingly, about 77% of companies with more than 1000 developers that run Kubernetes are using it in production.
Furthermore, VMware has recently announced the Project Pacific that completely rebuilds vSphere architecture. Kubernetes is going to be a control plane in future vSphere versions. Sounds amazing, doesn’t it?
I hope you have warmed up and taken an interest in something that may not have been familiar with – Containers and Kubernetes. I believe so and recommend to read about Kubernetes and Docker concepts before we get started.
We’re gonna do some tasks in Azure Kubernetes Service (managed Kubernetes service in Azure) to help you to dive into Kubernetes and also get hands on experience with related services such as Container Registry, AKS, Terraform and Docker.
This GitHub Repo includes everything covered in this blog post
This lab uses a custom and simple ASP.NET Core web application that we will deploy to, and then publish by using Kubernetes (K8S)
Docker multistage image build packs up the application
Azure Container Registry stores the Docker image
Terraform automates deployment of Azure Kubernetes Service and Azure Container Registry. Scripts are stored at the different repo
Azure Kubernetes Services provides a managed Kubernetes master node in the cloud with ability to scale up worker nodes. AKS will host our PODs (roughly speaking, PODs represent process/containers running on k8s cluster)
Azure CLI, PowerShell, docker, terraform, kubectl (command line interface for running commands against Kubernetes clusters) are the main tools for completing tasks. Make sure you have them installed on your machine or use Azure Cloud Shell instead.
Create a Service Principal beforehand (Conributor role)
Azure DevOps is used for CI/CD (optional)
Deploy Kubernetes cluster in Azure
Although, we can use Azure Portal, CLI or PowerShell to deploy new Azure services, using Infrastructure as Code (IaC) approach is more visionary. We will use Terraform, so check out my repo and comments inside . Terraform creates Azure Container Registry:
#Get RG (create a new one if necessary by using "resource azurerm..")
data "azurerm_resource_group" "Rg" {
  name = "kubRg"
}

............

#Create a container registry
resource "azurerm_container_registry" "cr" {
  name                = "cr${random_string.randomName.result}"
  resource_group_name = "${data.azurerm_resource_group.Rg.name}"
  location            = "${data.azurerm_resource_group.Rg.location}"
  admin_enabled       = true
  sku                 = "Basic"
  # Only for classic SKU (deprecated)
  # storage_account_id  = "${azurerm_storage_account.storacc.id}" (Classic)
}
..............
Configures Kubernetes cluster with Azure Container Network Interface (CNI) to allow you to access PODs directly as every POD gets an IP from Azure subnet rather than use kubenet . At the end of configuration file, terraform enables K8S RBAC (it’s disabled by default in Azure) that we’ll use later during the service accounts creation.
Apply the configuration, and then check the output (in my case, resources have been already deployed, so nothing to add). Note ACR and AKS resource names (/managedClusters/…; registries/…)
For an additional deployment check , open up the Azure Cloud Shell or Azure CLI and type the following to open Kubernetes portal:
#Get Azure AKS Credentials
az login
az aks get-credentials --resource-group kubRg --name rlk8sclu-l3y5

#Open K8S dashboard
kubectl create clusterrolebinding kubernetes-dashboard --clusterrole=cluster-admin --serviceaccount=kube-system:kubernetes-dashboard
az aks browse --resource-group kubRg --name rlk8sclu-l3y5

#View kubectl config (optional, %HOMEPATH%/.kube/config)
kubectl config view
If your browser shows up a new page, likely there aren’t any issues with the deployment. Let’s jump into the second task.
TIP: get addresses of the master and services by running kubectl cluster-info
Make Docker image with the application
Let’s create a docker image with the application, and then push the image to the Azure Container Registry. The Dockerfile is located at the root of the aspnetapp folder (check out my repo) and describes multi-stage image build process. There is also the Dockerignore file to define folders that must be excluded from the image.
Run the Docker CLI and build the image (docker build <dir>):
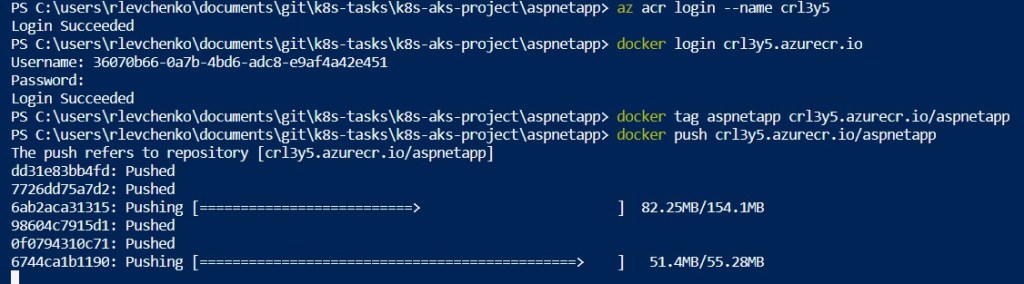
Push the image to Azure Container Registry:
az acr login --name acrName
docker login acrFQDN
docker tag aspnetapp acrFQDN/aspnetapp
docker push acrFQND/aspnetapp
TIP: get the attributes of the image by running az acr repository show -n crl3y5 –image aspnetapp:latest
Make two fully isolated namespaces within the Kubernetes cluster
Once the docker image is uploaded to ACR, we are ready to proceed with the Kubernetes tasks. When you need something to change in K8S you may use kubectl to define operations sequentially or manifests files (yaml) that can describe multiple requests to K8S API Server in the declarative form.
If you look at my repo, you can see two folders ns1 and ns2 that store yaml/manifest files for respective namespaces. We’ll use that files in conjunction with kubectl to make some changes on the AKS cluster. Because manifests files are almost the same, only manifests for NS1 will be shown.
#Apply the manifest (example)
kubectl apply -f pathToTheManifestFile
TIP: use kubectl get namespaces to list namespaces and kubectl get networkpolicy -n ns1 to get the policy
Configure anti-affinity for PODs
To make sure that group of PODs (labelSelector section) in the cluster running on particular nodes , we need to configure affinity/anti-affinity rules. This anti-affinity “rule” ensures that each POD with app=aspcore label does not co-locate on a single node.
TIP: use kubectl get pods -o wide-n ns1 to get info about assigned nodes, and then kubectl get nodes –show-labels to check node labels
Configure network policy to deny egress traffic from PODs (except DNS requests)
This task shows how you can filter network traffic from PODs in the namespace. All PODs with the app=aspcore label in the first namespace can make only DNS requests (out), other ones will be denied.
TIP: get list of the network policies kubectl get networkpolicy -n ns1
Create a service account with read permission on PODs in the first namespace
A service account provides an identity for processes that run in a Pod. This except of manifest file describes a service account read-sa-ns that has read only permissions on PODs in the NS1 namespace (the rules section/verbs). Also, note that rbac role is used which we have enabled during applying the terraform configuration.
#New SA - ns level
apiVersion: v1
kind: ServiceAccount
metadata:
  name: read-sa-ns
---
#New Role - ns level
apiVersion: rbac.authorization.k8s.io/v1
kind: Role
metadata:
  name: read-only-ns
  namespace: ns1
rules:
  - apiGroups: ["", "extensions", "apps"]
    resources: ["pods"]
    verbs: ["get", "list", "watch"]
---
#Binding the role to the sa -NS1
apiVersion: rbac.authorization.k8s.io/v1
kind: RoleBinding
metadata:
  name: read-ns1-pods
  namespace: ns1
subjects:
  - kind: ServiceAccount
    name: read-sa-ns
    apiGroup: ""
    namespace: default
roleRef:
  kind: Role
  name: read-only-ns
  apiGroup: rbac.authorization.k8s.io
TIP: get roles in the NS1 namespace kubectl get role -n ns1 , and then check service accounts in K8S cluster kubectl get serviceaccounts –all-namespaces
Set CPU and RAM limits for each pod
If a container is created in the ns1 namespace, and the container does not specify its own values for memory request and memory limit, the container is given a default memory request of 128 MiB and a default memory limit of 400 MiB. In addition, you can define limits on the PODs level.
TIP: check the limits by running kubectl describe pod podname -n ns1
Configure PODs scalability based on CPU metric
Kubernetes allows you to automatically scale PODs based on the CPU/RAM metrics (horizontal pod autoscaler). If CPU average utilization is equal or greater than 70%, K8S deploys additional replicas (spec stenza, maxReplicas).
TIP: to list the NS limits kubectl describe namespace ns1
Publish the application
Now it’s time to publish the application running on a container. First, create a POD that will use our docker image that we’ve already pushed to the Azure Container Registry. A one Pod with the latest image will be created under the ns1 namespace. Check labels (one of the most important things, actually in K8S 🙂 ) , pod name and number (replicas)
TIP: use kubectl get pods -n ns1 -o wide to check the pod state in the ns1
If the Pod’s status is running, you can publish it via the LoadBalancer service:
#Publish the deployment through the Service

apiVersion: v1
kind: Service
metadata:
  name: demo-service1
  namespace: ns1
spec:
  selector:
    app: aspcore
  type: LoadBalancer
  ports:
    - name: name-of-the-port
      port: 80
      targetPort: 80
Then check the deployment status, and get public ip of the service:
#Get deployments in the NS1
kubectl get deployments -n ns1

#Get Service's Public IP
kubectl get service -n ns1 -o jsonpath='{.items[].status.loadBalancer.ingress[0].ip}'
Open up the browser and navigate to http://publicip/api/values to verify that application is published and works:
What’s next?
Complete the following homework tasks to boost your skills:
Make atest POD with a static volume (use Azure storage)
Make sure that PODs are running under non-root account
Create a service account with read permission on all PODs in the cluster
Add context details about service accounts to your configuration file (kubeconfig), and then verify service accounts permissions
Configure PODs scalability based on RAM or network metrics
While the GitLab UI and API are the standard tools for day-to-day operations, they often hit a wall when dealing with massive datasets. API rate limits can slow down bulk cleanup tasks, and the UI is ineffective for managing thousands of objects.
In such situations, we sometimes need direct, fast access to GitLab’s internal data. This is where the GitLab Rails console comes in. Built on the Ruby on Rails framework, the Rails console provides a command-line interface for interacting directly with GitLab’s application models using the Ruby language.
The Rails console is fast and flexible, but also unforgiving: a single command can modify or delete production data instantly.
At the core of the GitLab Rails console is ActiveRecord, the Object–Relational Mapping (ORM) layer provided by Ruby on Rails. ActiveRecord acts as a bridge between Ruby objects and database tables, allowing to work with database records using plain Ruby code instead of raw SQL (“just a wrapper”).
Basics
Run the rails console on your GitLab server:
sudo gitlab-rails console
Once loaded, enable the debug mode:
ActiveRecord::Base.logger = Logger.new($stdout)
Consider the following command:
prj = Project.find_by_full_path(test/test2)
Project is a model mapped to the projects database table
find_by_full_path is a model method that builds a SQL query using the provided project path (try to type Project. and press tab to initiate autocompletion, the console will display all available methods for the Project model)
prj is a variable to store Ruby’s object or nil (if no project found)
Project.methods.grep(/find/) will show methods available to Project model containing find word. Use <model>.methods and <object>.attributes to get all available methods and properties of object (e.g. prj.attributes and project.methods)
Next, if we run prj.container_repositories we will see actual SQL query used by the code, so we are interacting with the container_repositories table
D, [2025-12-24T09:47:41.526263 #4889] DEBUG -- : ContainerRepository Load (1.8ms) /*application:console,db_config_database:gitlabhq_production,db_config_name:main,console_hostname:gitlab.example.com*/ SELECT "container_repositories".* FROM "container_repositories" WHERE "container_repositories"."project_id" = 1 /* loading for pp */ LIMIT 11
Consider you need to find all projects with at least one tag in the repo
count = 0
Project.find_each do |project|
  if project.has_container_registry_tags?
    count += 1
  end
end
puts "Total projects: #{count} "
and result is Total projects: 2567
Thousands of projects in the GitLab were “queried” in just a few seconds. That’s a magic of GitLab Rails console that API doesn’t have.
Some explanations:
count = 0 simply a local variable; our counter
Project.find_each loads projects in batches
do | project | starts a loop and assigns each project to the variable project
if project.has_container_registry_tags? main logic, clear enough to any
count += 1increments our counter
puts "Total projects: #{count}" prints result once the loop is finished
If you need to show project paths and print projects with image tags:
count = 0
Project.find_each do |project|
  puts project.full_path
  if project.has_container_registry_tags?
    puts "  -> Project has container registry tags"
    count += 1
   end
 end
puts "Total projects: #{count} "
Result:
test/project1
test/test2
-> Project has container registry tags
test2/test2
Try out different models such as User, Group, Ci::Pipeline and others
Zombies
An interesting behavior to note is that destroying a repository object via repo.destroy! does not automatically purge the physical data from the storage backend. If the Container Registry is active, GitLab’s background processes or a simple page refresh may trigger a “re-sync.”
You run repo.destroy! on repository ID 16.
The database record is deleted, but the physical tags remain in storage.
GitLab detects the existing data at that path and automatically creates a new record in a database
A new repository appears with a new ID 17, containing all the old tags.
To prevent this “zombie” effect, you should always delete the tags through the GitLab API or Rails methods before destroying the repository record, and follow up with a Registry Garbage Collection to reclaim the disk space
gitlab-ctl registry-garbage-collect -m
#removes untagged manifests and unreferenced layers as well
#wont'work if the container registry is disabled
You can write a simple command to delete the repo and tags in the test/test2 project (DANGER):
prj = Project.find_by_full_path("test/test2")
  prj.container_repositories.each do |repo|
    repo.delete_tags!
    repo.destroy!
end
delete_tags and has_container_registry_tags? methods require availability of GitLab Container Registry. Otherwise, the following error shown “Failed to open TCP connection to localhost:5000 (Connection refused – connect(2) for “localhost” port 5000) (Faraday::ConnectionFailed)”
Other examples
To delete image tags and container registry repositories (DANGER):
Project.find_each do |p|
    next unless p.has_container_registry_tags?
    p.container_repositories.each do |repo|
      puts "Cleaning tags for #{p.full_path}"
       repo.delete_tags!
      puts ":::Destroying the repo for #{p.full_path}"
       repo.destroy!
    end
end
next unless can be read as “if repository doesn’t have any container registry tags, skip it and find relevant projects“; works faster and looks cleaner
If your Container registry has been disabled and you need to clean container registry repositories:
temporary enable the container registry service (recommended) OR
destroy registry repositories, and then manually clean file storage (based on my testing, we need to interact with /var/opt/gitlab/gitlab-rails/shared/registry/docker/registry/v2/ after deleting registry repos via GitLab rails , and likely it doesn’t break anything; blobs and repositories folders will be created automatically once you pushed any images again)
Anyway, do you own research before any change!
To find projects with container registry repo when registry has been disabled:
count = 0
Project.find_each do |project|
  if project.container_repositories.count > 0
    puts "  -> Project #{project.name} has container repos"
    count += 1
   end
 end
puts "Total projects: #{count} "
To delete container registry repos when registry has been disabled (DANGER):
Project.find_each do |p|
    next unless p.container_repositories.count > 0
    p.container_repositories.each do |repo|
      puts ":::Destroying the repo #{repo.name} for #{p.full_path}"
       repo.destroy!
    end
end
Use case: deleting registry repositories while registry is disabled will help you to transfer a project (if you need). Otherwise, GitLab won’t allow you to change the path or namespace of any project.
While the scripts above are powerful, they are also permanent. Treat the Rails console like a sharp blade: incredibly useful, but dangerous if handled carelessly. And don’t forget these rules 1. Do Your Own Research. 2. Audit with puts before execution of harmful queries (destroy and other methods) . 3. Test every query on a single project before running a batch.
If you run GitLab (or any application that modifies file permissions or ownership of files in volume mounts) in a container, you may see the installation fail with an error like:
chgrp: changing group of '/var/opt/gitlab/git-data/repositories': Operation not permitted
This error prevents GitLab from starting. Here’s why it happens—and the simplest way to fix it.
A local GitLab installation was required to troubleshoot and verify several production-critical queries. This setup is clearly not intended for production use and should be used only for testing and troubleshooting purposes.
Also, Windows is not officially supported as the images have known compatibility issues with volume permissions and potentially other unknown issues (although, I haven’t noticed any issues during a week)
Both Podman Desktop and Docker Desktop run containers by using WSL2
The problem appears when you bind-mount a Windows directory (NTFS) into the container, for example:
The same command works fine with Docker Desktop (E is an external disk drive available to Windows host)
What goes wrong
So far, we have the following flow:
GitLab requires real Linux filesystem permissions and ownership
During startup, it runs chown and chgrp on its data directories
Windows filesystems (NTFS) do not support Linux UID/GID ownership
WSL2 cannot translate these permission changes correctly
The operation fails, and GitLab refuses to start
If both Podman and Docker are based on WSL2, why does Docker run GitLab on an E: drive without breaking a sweat? The root cause is the difference in how Docker and Podman translate file permissions.
Docker: if GitLab calls chgrp, WSL’s drvfs layer intercepts the call. It doesn’t actually change the Windows folder, but it records the “permission change” in a hidden metadata area (NTFS Extended Attributes).
/etc/wsl.conf content of the docker desktop engine:
When metadata is enabled as a mount option in WSL, extended attributes on Windows NT files can be added and interpreted to supply Linux file system permissions.
Podman: mounts Windows drives using the standard WSL2 9p protocol and drvfs driver (as Docker actually) without the complex metadata mapping enabled by default. When GitLab/your app tries to set its required ownership, the mount simply refuses, causing the container to crash
Here is an output for E disk drive mount from the podman machine:
mount | grep " /mnt/e "
E:\ on /mnt/e type 9p (rw,noatime,aname=drvfs;path=E:\;uid=1000;gid=1000;symlinkroot=/mnt/,cache=5,access=client,msize=65536,trans=fd,rfd=5,wfd=5)
there is no metadata option for the mount because of such simple wsl.conf:
[user]
default=user
Solution
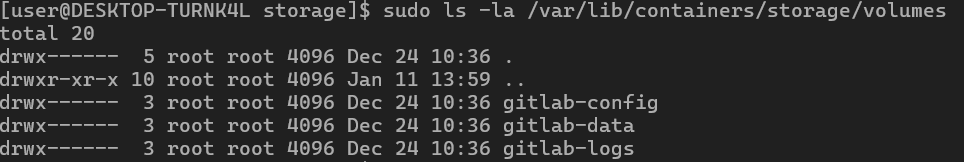
The easiest solution here is to use named volumes (universal and faster) or a bind mount (if Docker is used; slower); custom wsl.conf and bind mount (if Podman is used; slower)
[interop] enabled=true is not actually required since it’s true by default, then restart podman and try podman run again
Docker and Podman use different WSL default configurations. Docker tolerates emulated ownership changes by enabling the metadata option out of the box.
Podman, on the other hand, does not rely on this metadata and expects real Linux filesystem behavior. It is also daemonless and lighter than Docker—but that’s a story for another blog post.